
Performance testing is to test the speed, reliability, response time, and resource usage. The goal behind performance testing is to identify and eliminate any potential resistances to the software application.
JMeter is an open-source, Java-based software. It is used to perform load testing, functional behavior, and measuring performance. JMeter Performance Testing Services includes the process of testing the performance of a web application using JMeter.
Table Of Contents
- Prerequisites
- JMeter performance testing steps (Process)
- Launch JMeter
- Record JMeter script
- Method 1: adding manual record from JMeter
- Method 2: use .CSV for multiple users
- Method 3: use a recording tool for the JMeter script.
- Execute JMeter script
- Conclusion
Let’s Start with Prerequisites. These things are required in your system before you start with JMeter performance testing.
Prerequisites
- Install Java in the system (Windows, Linux, Mac OS)
- Download JMeter. Click Here
- Install JMeter Report Plugins To Generate report
1. Download the JMeter plugins Click here
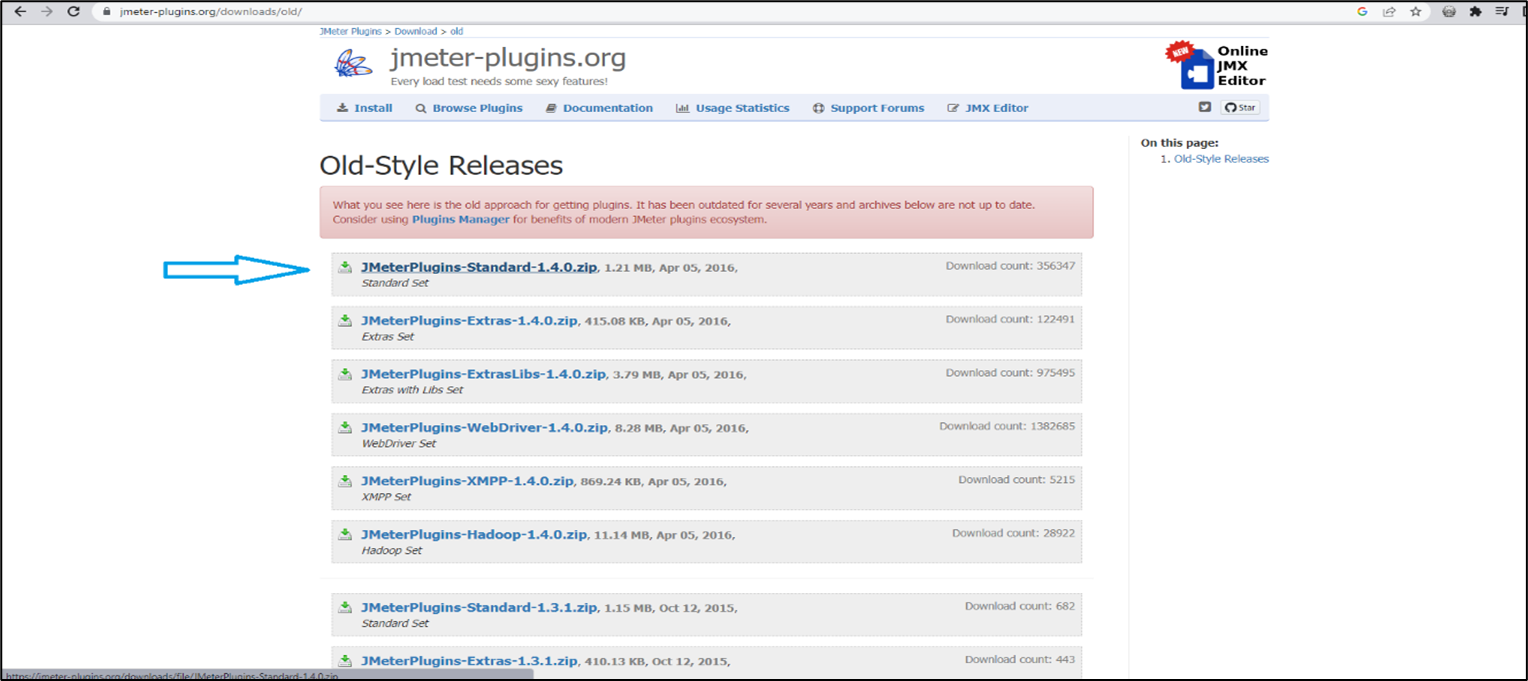
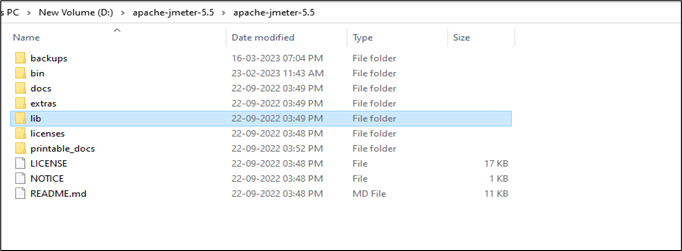
2. Replace the lib folder with downloaded JMeter plugins
JMeter Performance Testing Steps (Process)
Launch JMeter
Move to the extracted folder to open the program.
Run the jmeter.bat (Windows Batch File)

Record JMeter Script
Record JMeter script means adding data in JMeter that is used to perform testing. There are multiple ways to record JMeter test case scripts for performance testing.
Method 1:Adding Manual Record from JMeter
For the basic program, refer to our previous article on JMeter Performance Testing for Beginners. In the previous article, we have explained manual record entry.
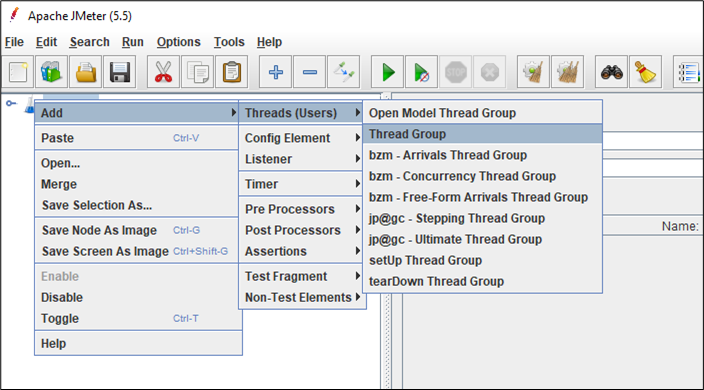
There are other methods as well to record data for advanced users. But before you go further, we need to setup the thread group:
Method 2: Use .CSV for multiple users
There are multiple steps involved in the process of adding. CSV records. Here is the step-by-step process to use. CSV for multiple users entry.
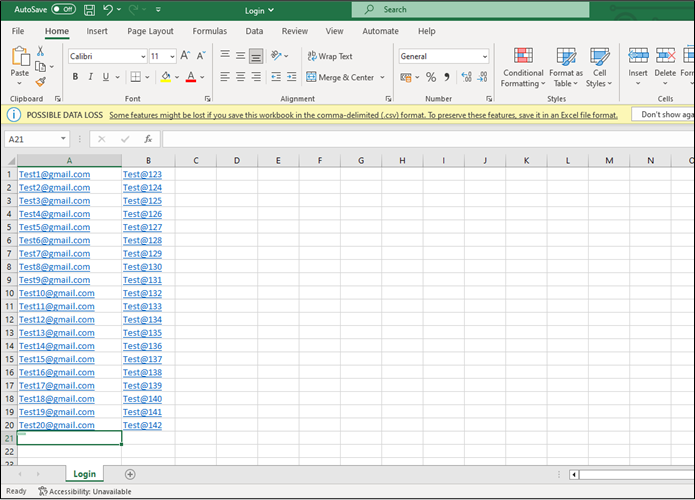
Step 1 - Create login.csv with two columns (username and password) and save it to your preferred location.
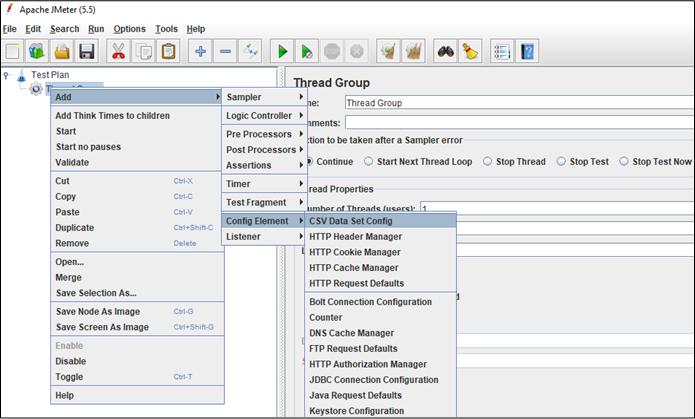
Step 2 - Right Click on “Thread Group” & Add & Config Element & CSV data set config.
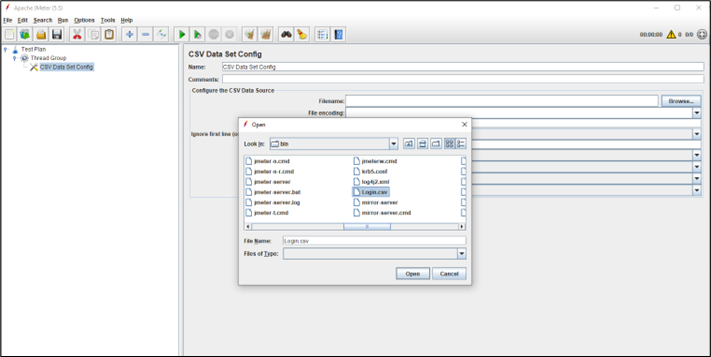
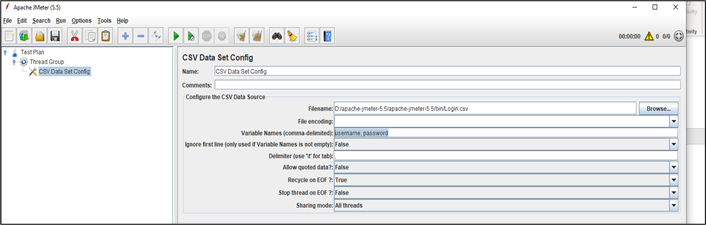
Step 3 - In “Filename” field, click on browse and select the file(Login.csv) you have created.

Step 4 - Add “Column names” in Variable Names field.
Step 5 - Right Click on “Thread Group” & Add & Sampler & HTTP Request
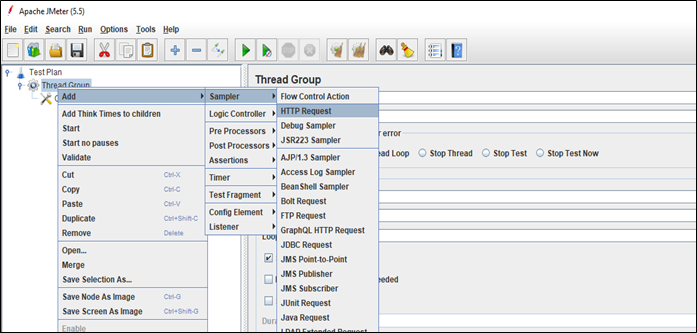
Step 6 - Pass the variables as Parameters in HTTP request
(Add Name: Email, Value: ${username}, Name: Password, Value: ${password} )
Method 3: Use a recording tool for the JMeter script.
In this method, we need tools or extensions to record our actions and data for JMeter script. There are various tools and extensions to perform such functionality. We have mentioned three as we found them easy to use. All recorded script is downloaded in .jmx format.

Badboy - you can download Badboy from here.
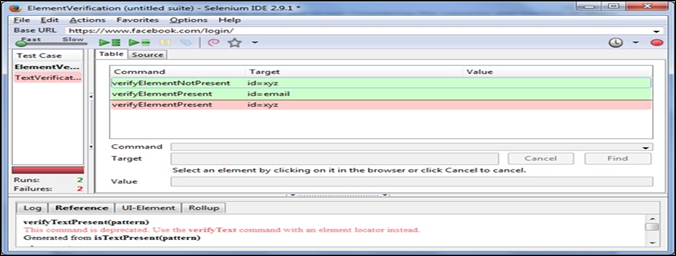
Selenium IDE using JMeter Plugin - you can download Selenium IDE from here.
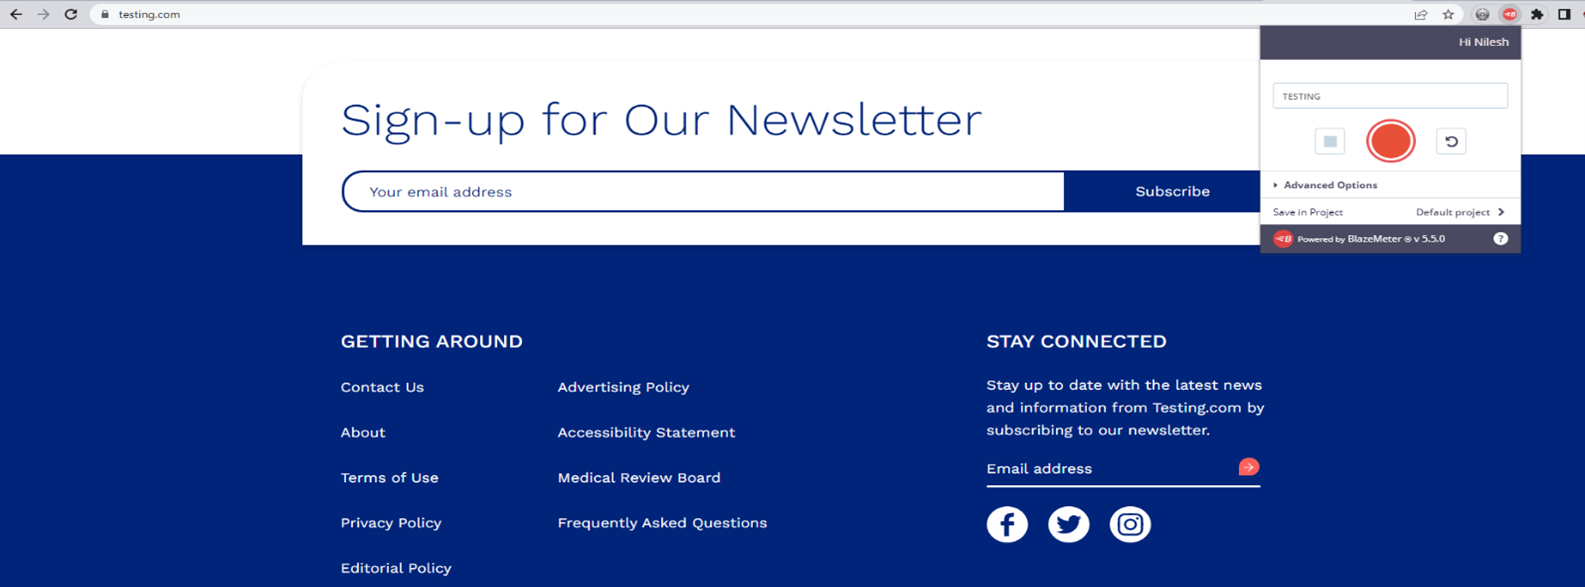
BlazeMeter plugin - you can download BlazeMeter plugin. This plugin is only available in the Chrome browser.
Once the recording is done, you need to open file in JMeter. For that, Go to File & open. And select recorded .jmx file/script.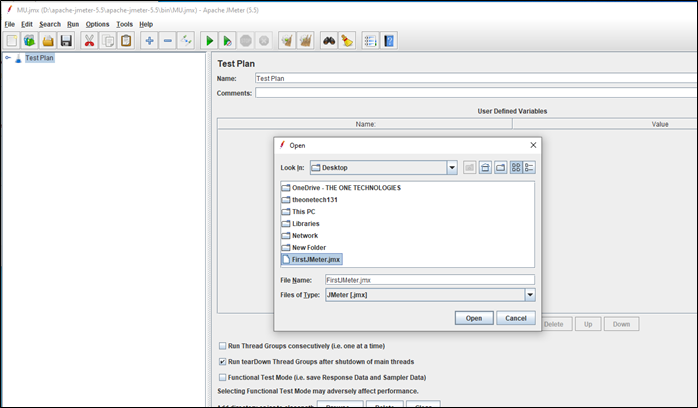
Execute JMeter Script
It's time to execute JMeter script and get the result. There are two formats to generate results in JMeter. One is Generic and available to all, and another is advanced that needs to install Plugin.
Default Report Format
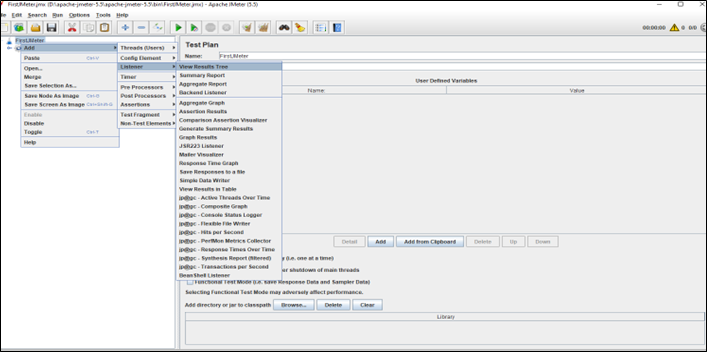
Step 1 - Right Click on “Thread Group” & Add & Listener & Result Tree
Step 2 - To run the JMeter program, Save the script and Click on Run Button or Press Ctrl+R

Advance Report Format Using plugins
In this advance report format, we will use the report we installed in the "Prerequisites" section of this article. We will showcase five types of reports:
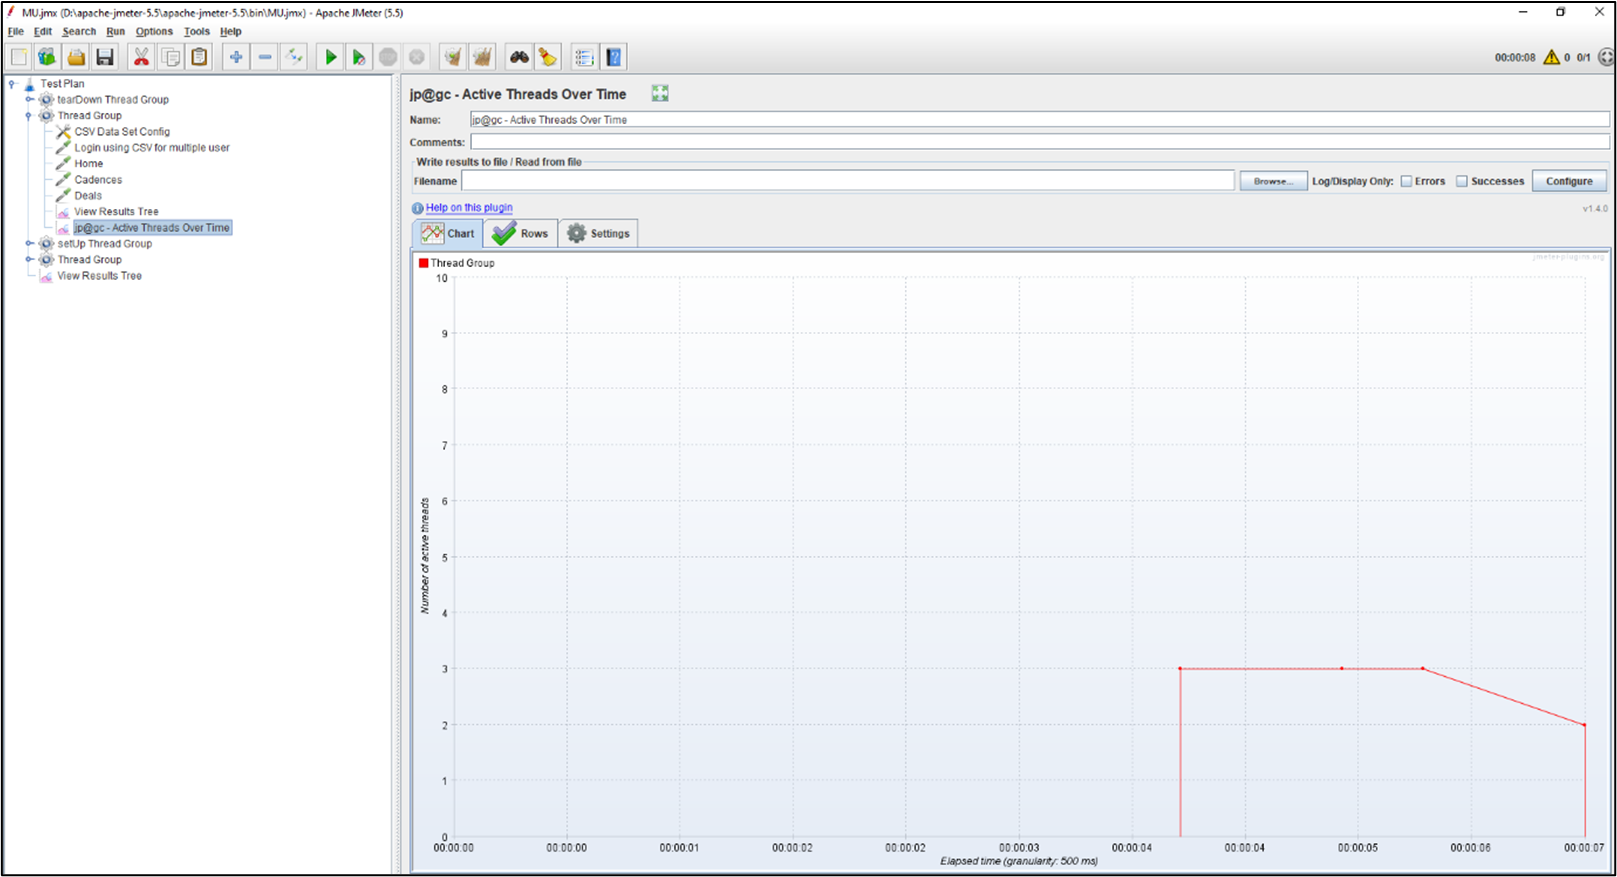
Active Thread Over Time -
- This report showcases that how many active threads are there in each thread group during the test run. To generate the report, you need to
Right Click on “Thread Group” & Add & Listener & click on “Active Thread Over Time”.
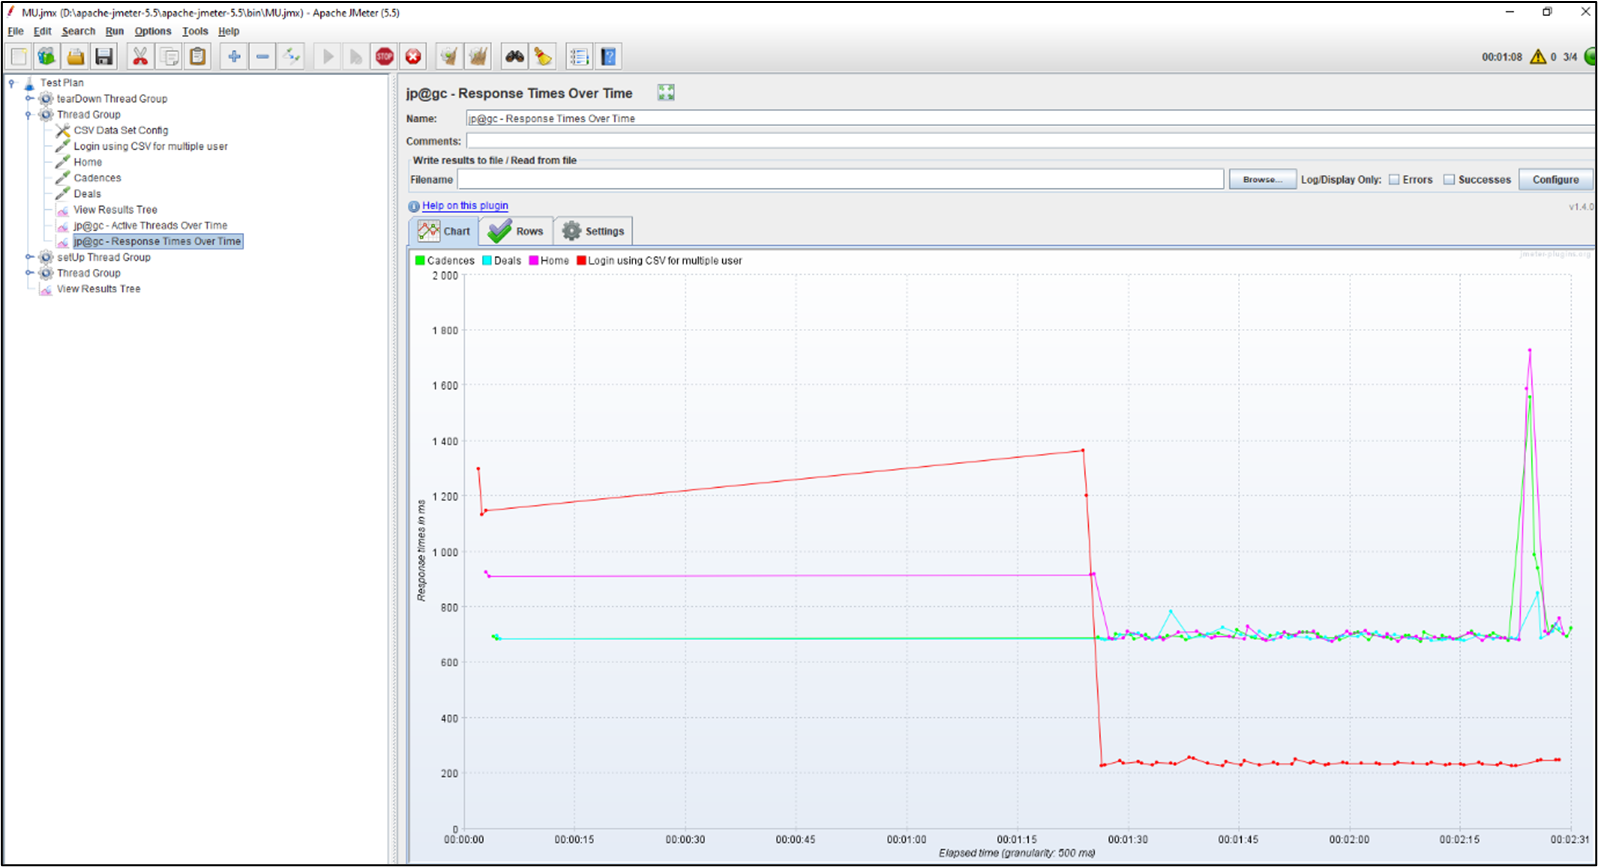
Response Times Over Time
- In this report, you will get the amount of time it takes for a server to respond to a client's request. To generate the report, you need to
Right Click on “Thread Group” & Add & Listener & click on “Response Time Over Time”.
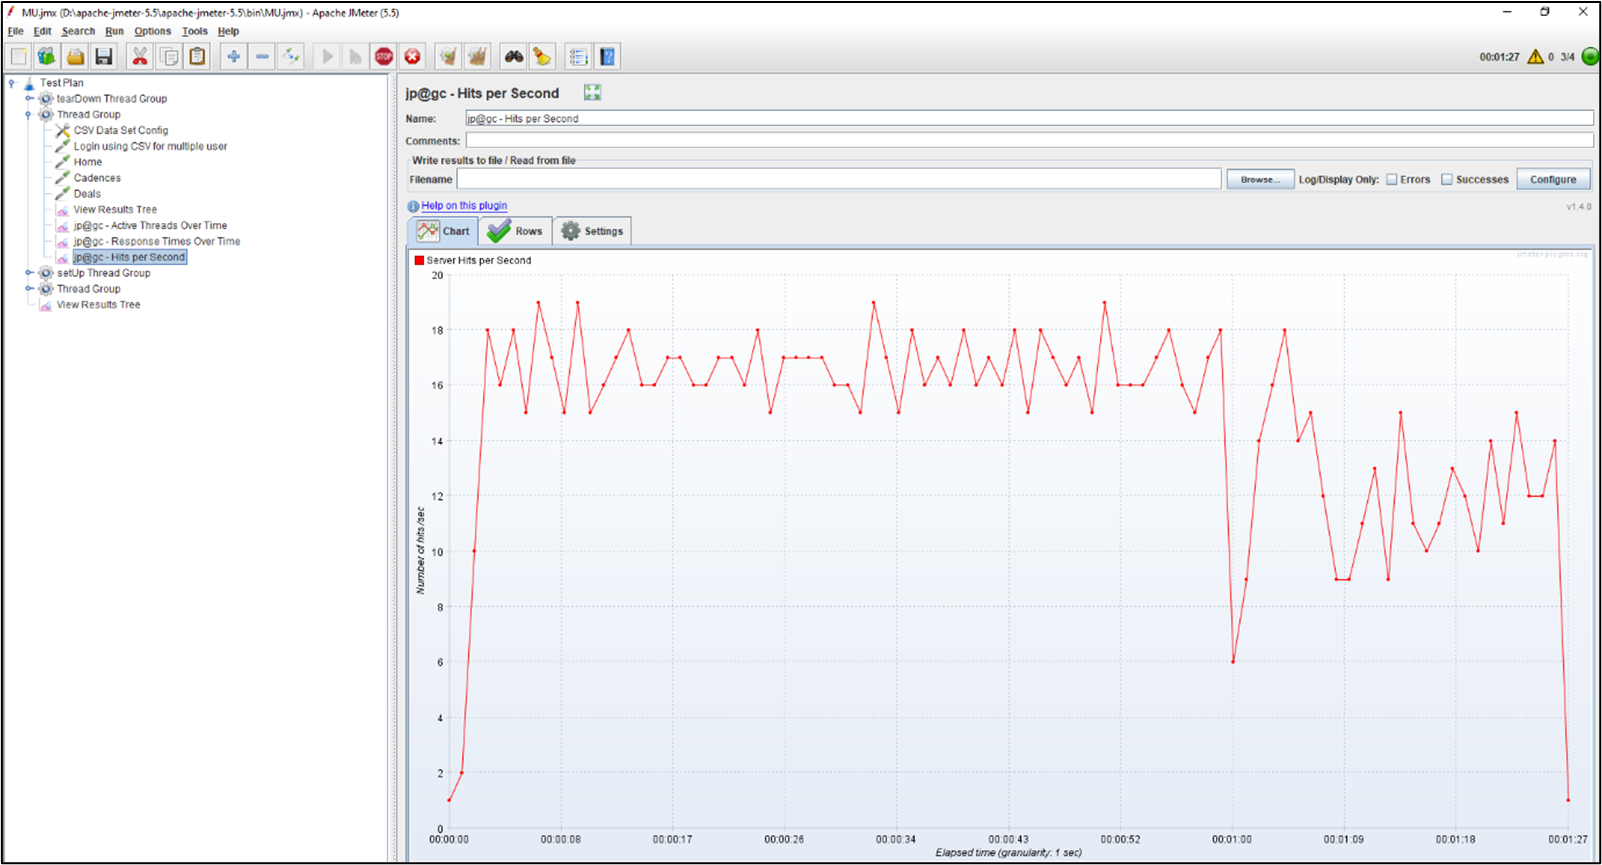
Hits per Second
- This report represents the number of requests sent to the server in one second.
To generate the report, you need to
Right Click on “Thread Group” & Add & Listener & click on “Hits per Second”.
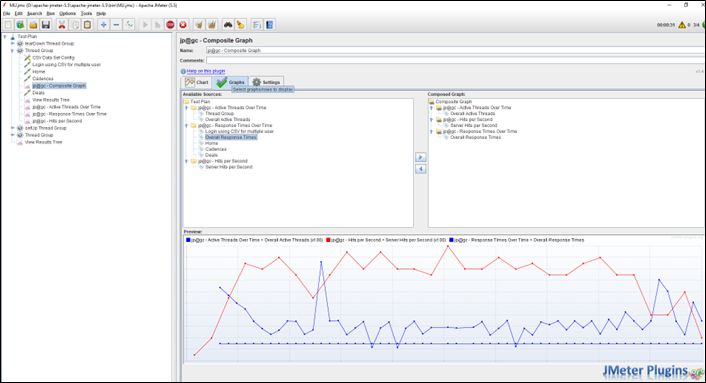
Composite graph
- As per the name, it combines three charts in one report. This report generates a graph with three components: active thread, server hits per second, and response time.To create the report, you need to
Right Click on “Thread Group” & Add & Listener & click on “Composite Graph”.
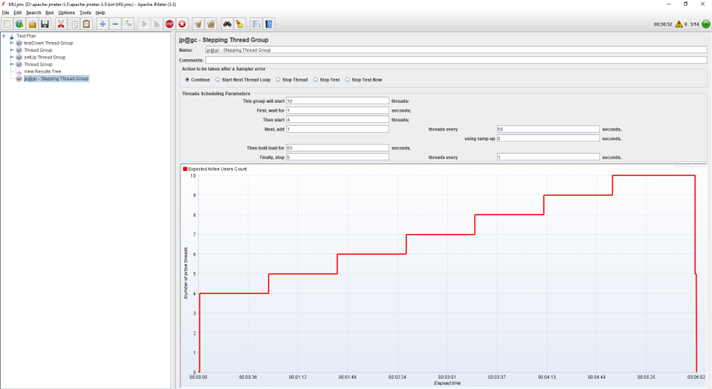
Stepping Thread Group
- It creates ramp-up and ramp-down scenarios in steps as part of JMeter load testing with different criteria/parameters. To generate the report, you need to
Right Click on “Thread Group” & Add & Listener & click on “Stepping Thread Group”.
Conclusion
JMeter is one of the performance testing tools that can help experts run performance and load testing for web applications. We have explained how you can create records/data and get the test report of your application through Software Testing Services. This way, you can improve the performance of your application.
About Author:
 Kevin Patel started his career as QA in Feb 2016. Currently, he is associated with Pixel QA as a Senior QA engineer. He has achieved two major certificates in QA Testing in different domains like accounting, e-commerce, healthcare, and payroll.
He loves challenges, team handling, and client communication. He would like to progress in his career as a QA Consultant in the IT field by achieving more QA standards.