
Table of Contents
- Introduction to JMeter
- Setting Up JMeter
- Creating Test Plans
- Scripting and Recording
- Assertions and Validations
- Monitoring and Reporting
- Advanced Techniques
- Performance Tuning
- Integration with CI/CD
- Tips and Best Practices
- Conclusion
Introduction to JMeter
What is JMeter?
Web-based apps are tested for performance using a free software named Apache JMeter. Performance testing services is a core capability of the tool. Online application testing was JMeter's main purpose; additional test features were added later.
Why Use JMeter?
- Open Source: JMeter is free and open-source.
- Versatile: Supports testing of various applications, servers, and protocols.
- Adaptive: Allows the generation of personalized plugins.
- Quick and simple to Use: Gives a strong graphic user interface and a simple interface for creating and maintaining test plans.
Key Features and Capabilities:
- Load and performance testing.
- Functional testing.
- Testing various protocols like HTTP, HTTPS, FTP, TCP, and more.
- Recording test scripts.
- Distributed testing.
- Real-time results and reporting.

Setting Up JMeter
Installation Guide:
#1. Download JMeter:
- Visit the Apache JMeter.
- Download the latest version of JMeter.
#2. Install JMeter:
Extract the downloaded file to a directory of your choice.
Ensure Java is installed on your system. Java 8 or later is essential for JMeter. Using the command line, type “java -version” to figure out the version of Java you are running.
To launch JMeter, navigate to the bin directory and run jmeter.bat (Windows) or jmeter.sh (Mac/Linux).
Configuring JMeter:
- Open JMeter. Properties file in the bin directory to customize your JMeter settings.
- Adjust heap size in jmeter.bat or jmeter.sh if needed, especially for large test plans.

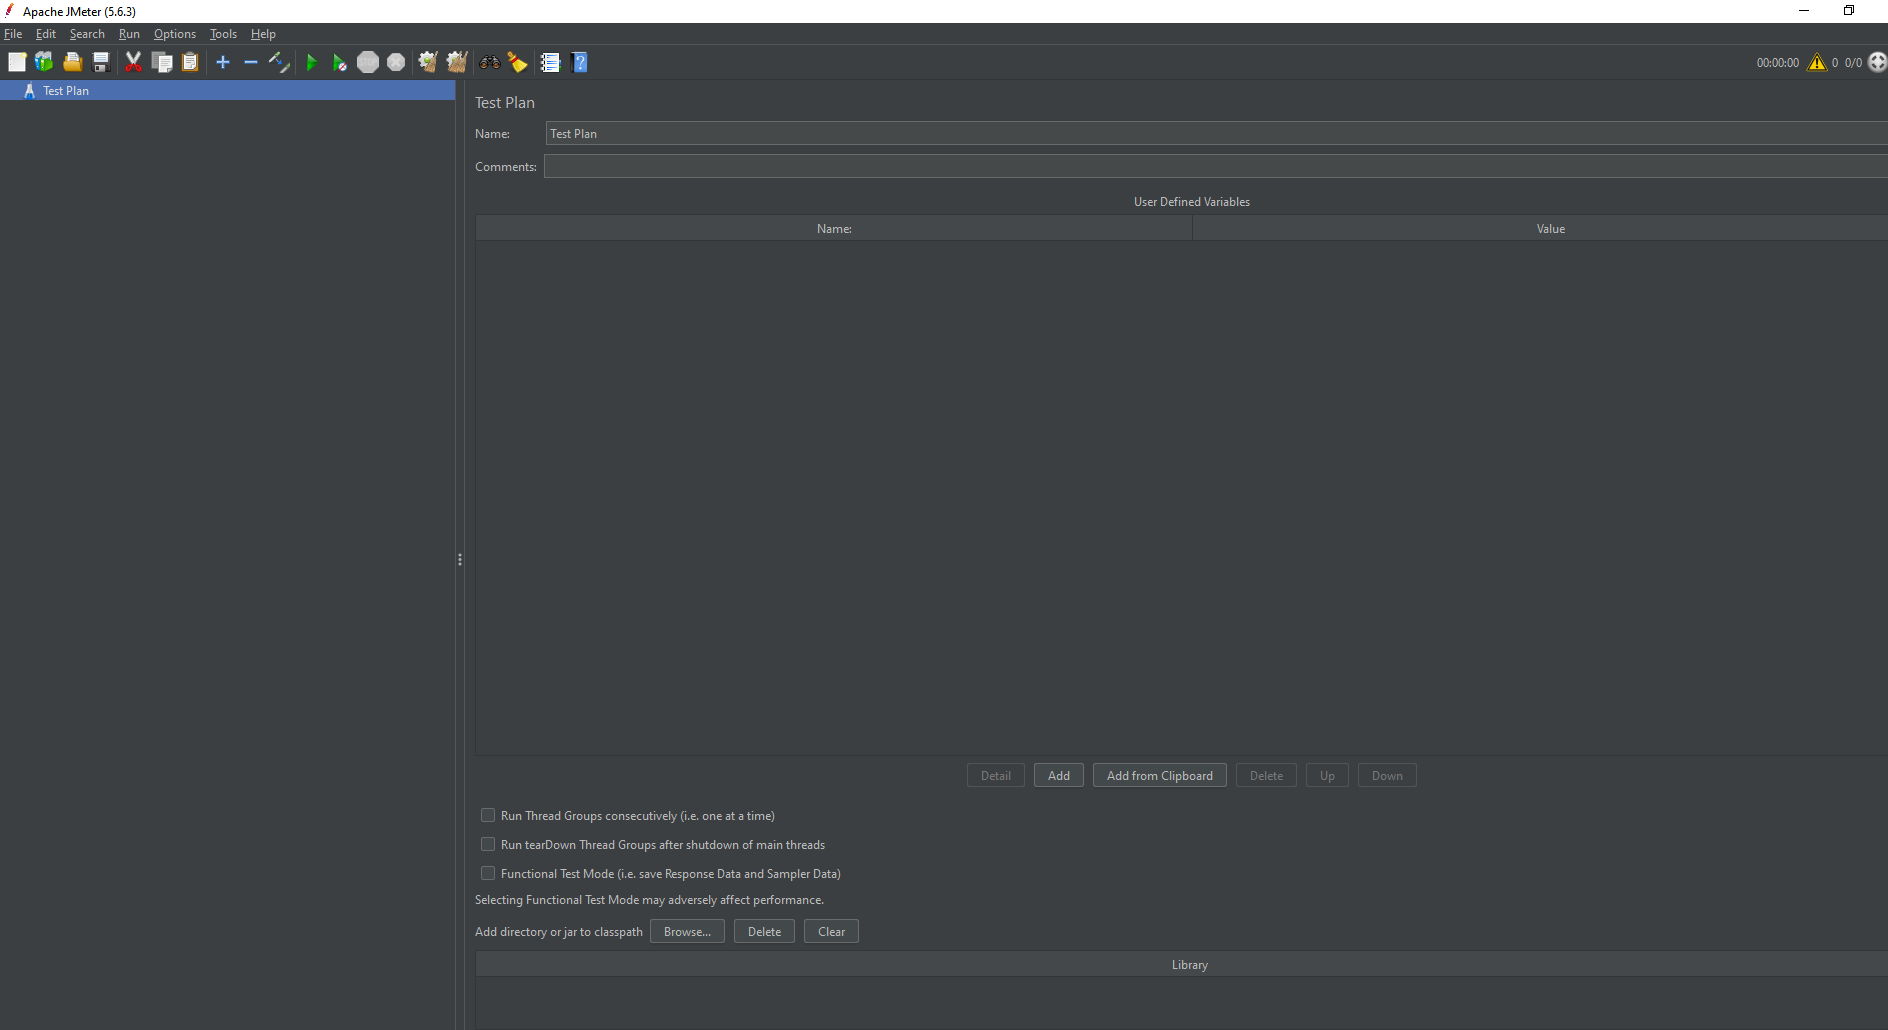
Creating Test Plans
Step-by-Step Guide to Create a Basic Test Plan:
#1. Open JMeter:
- Launch JMeter by running jmeter.bat (Windows) or jmeter.sh (Mac/Linux).
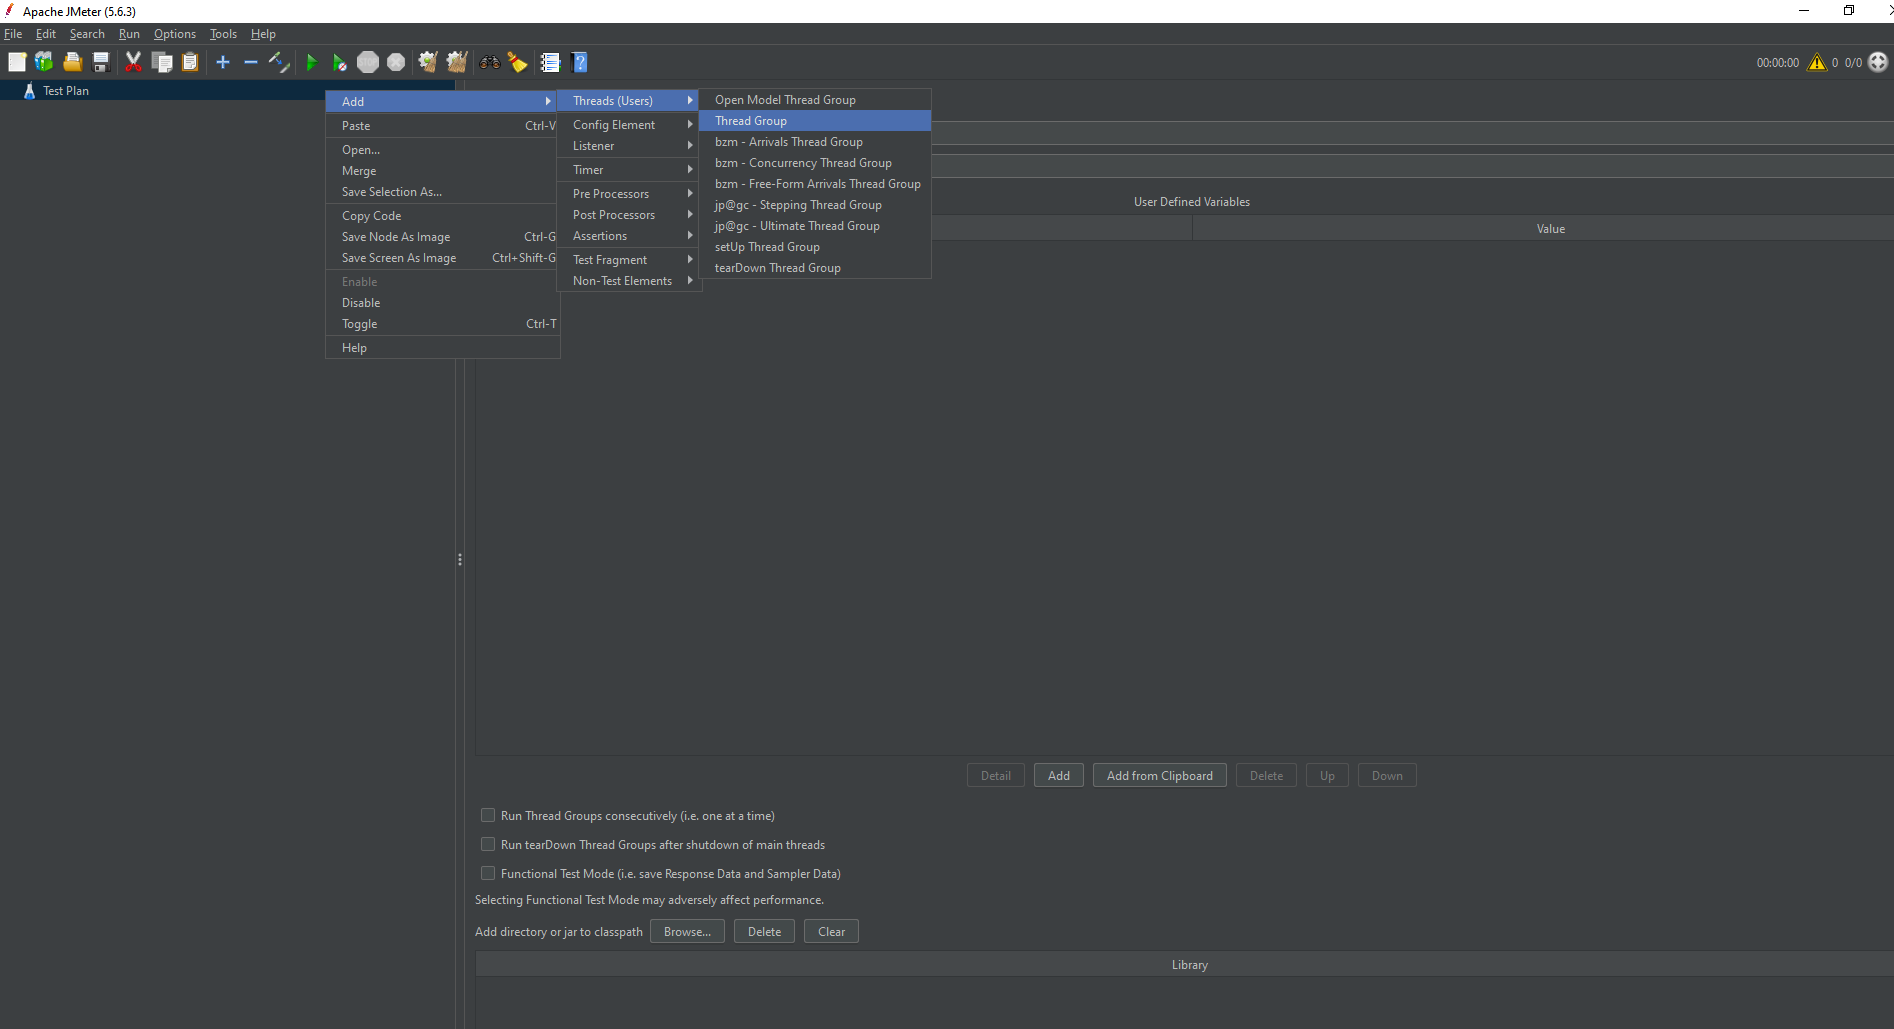
#2. Add a Thread Group:
- Right-click on Test Plan.
- Add -> Threads (Users) -> Thread Group.
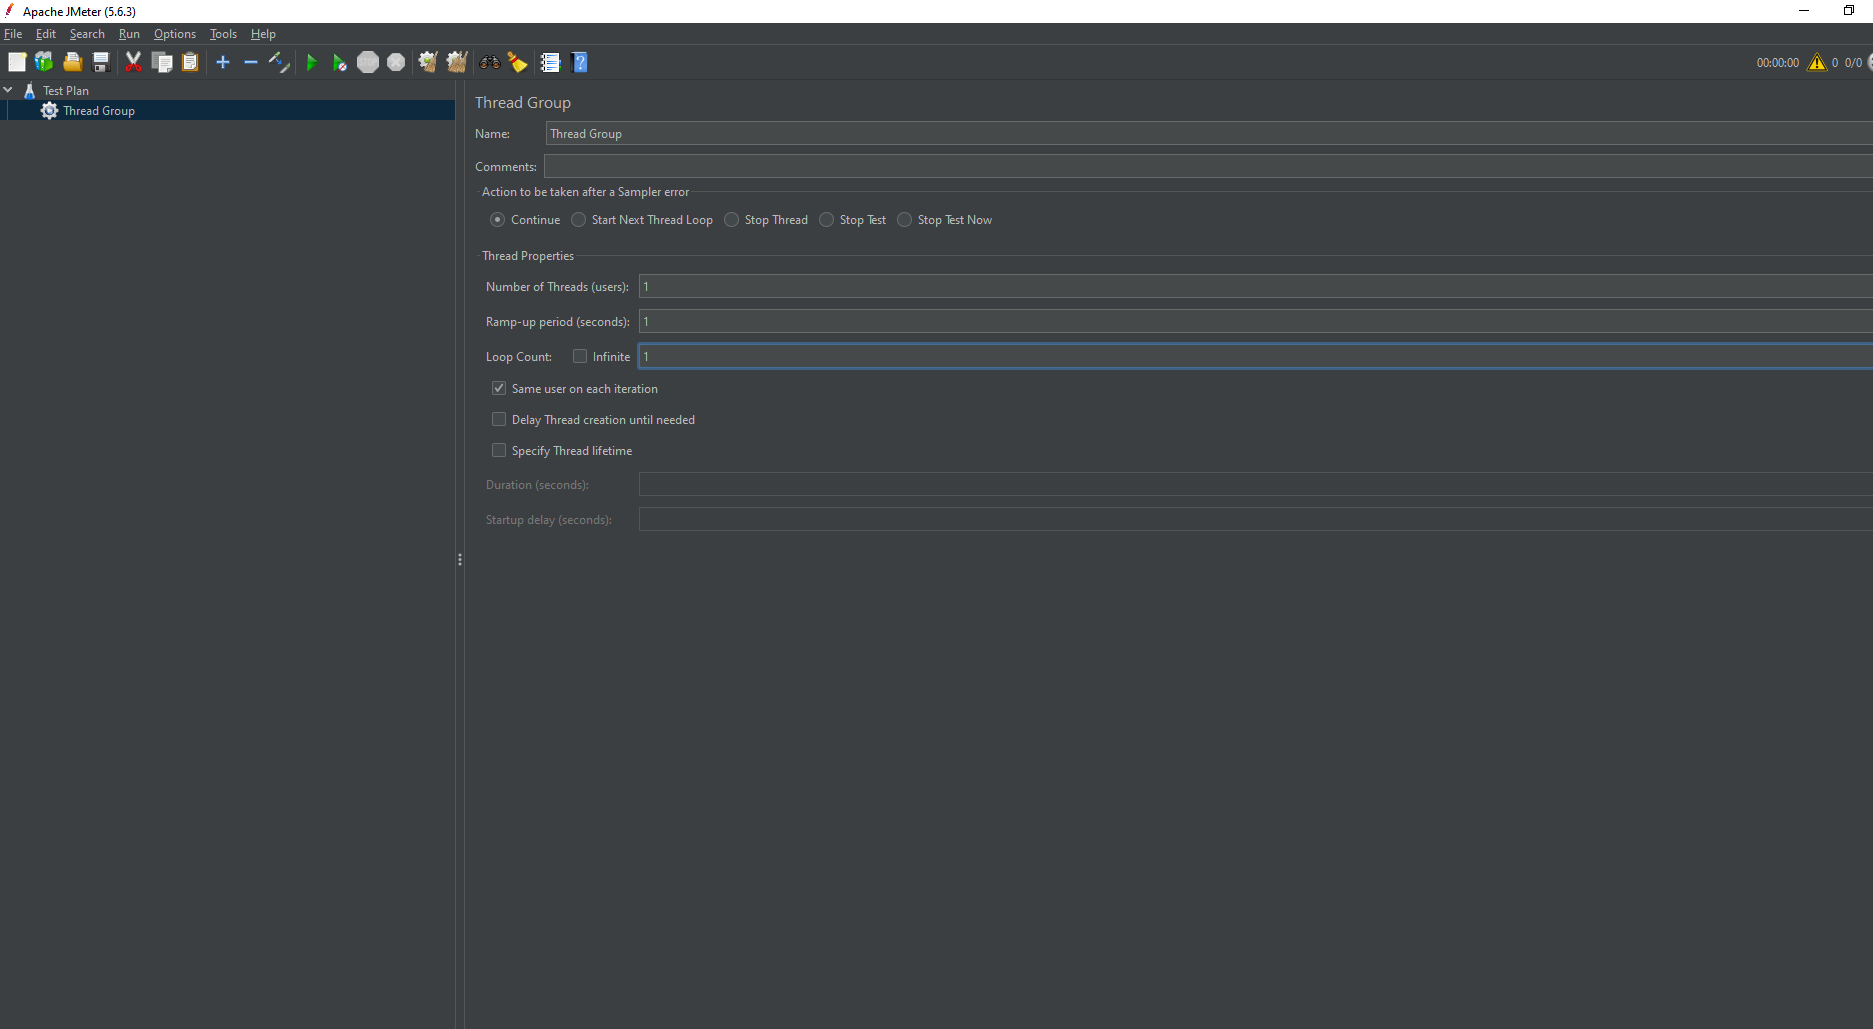
#3. Configure Thread Group:
- Set number of threads (users).
- Set ramp-up period (time to start all users).
- Set loop count (number of times to execute the test).
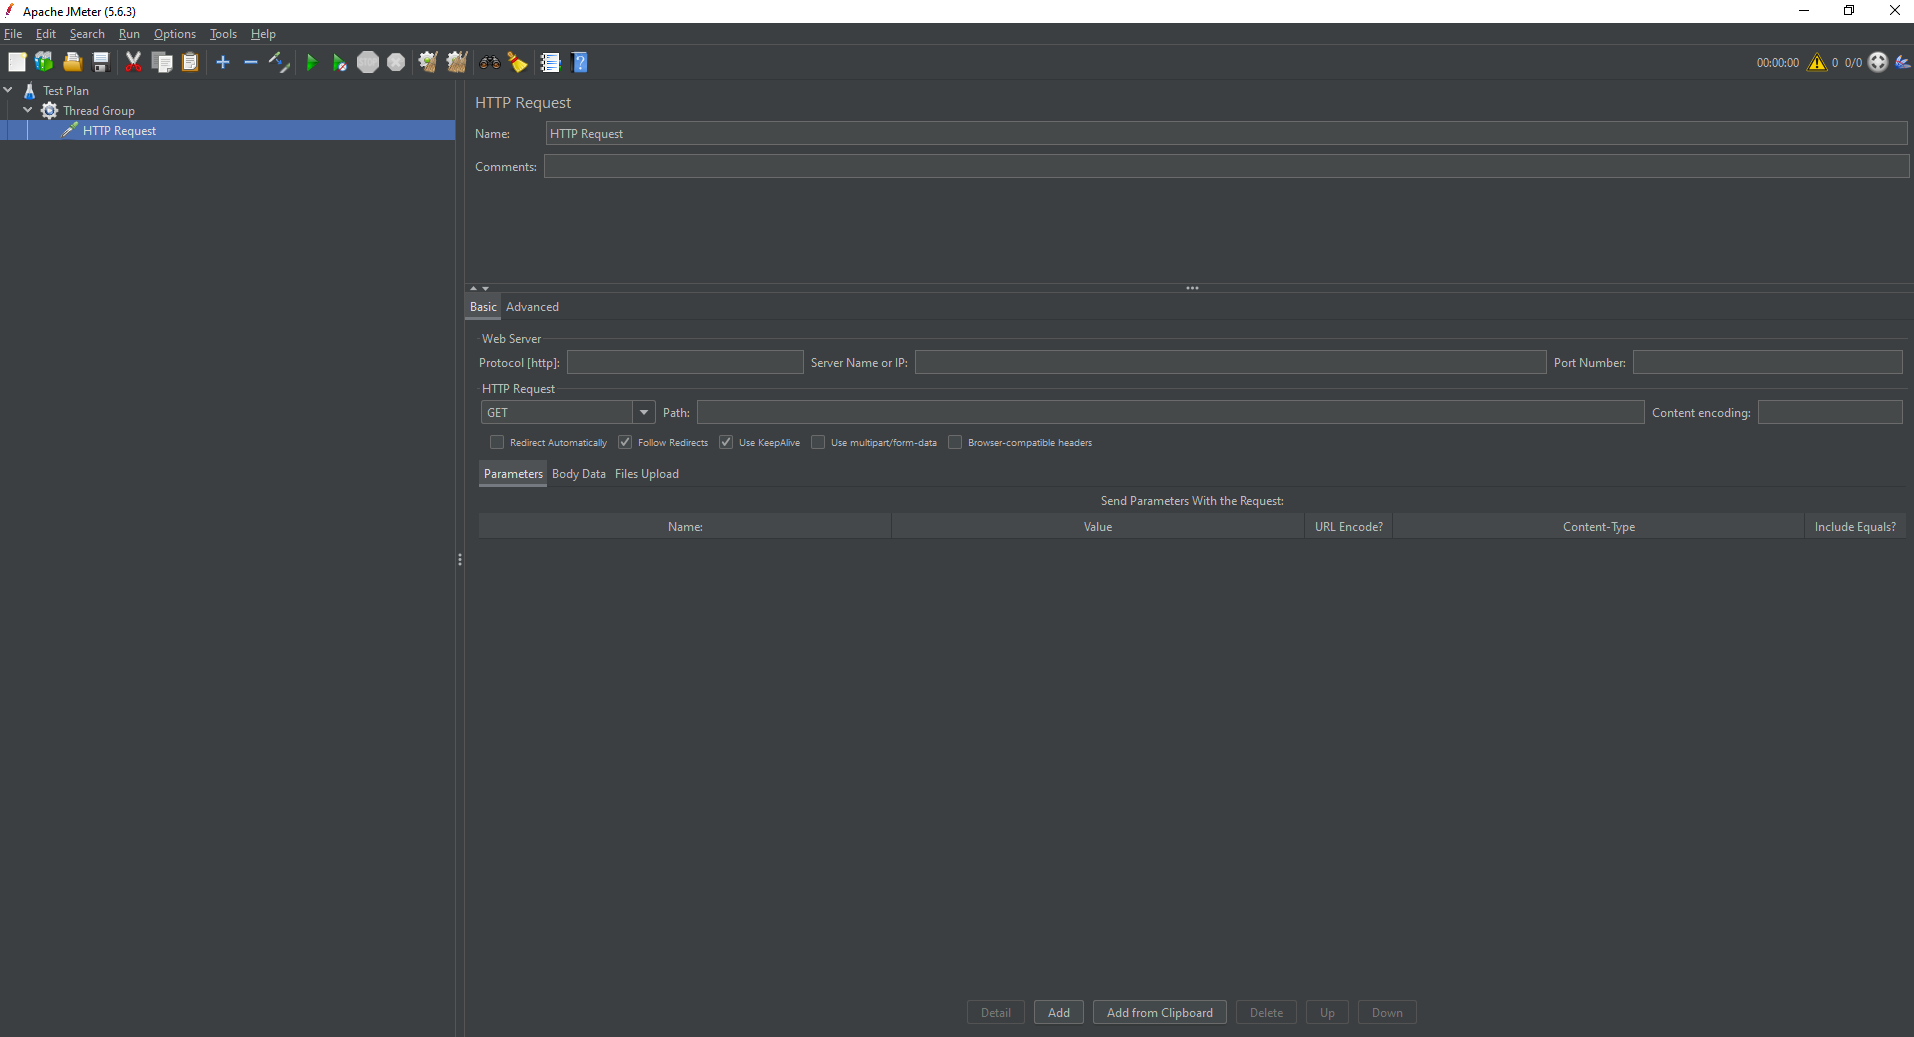
#4. Add Sampler:
- Right-click on Thread Group.
- Add -> Sampler -> HTTP Request.
- Configure the HTTP Request with the server's name, path, and parameters.
#5. Add Listener:
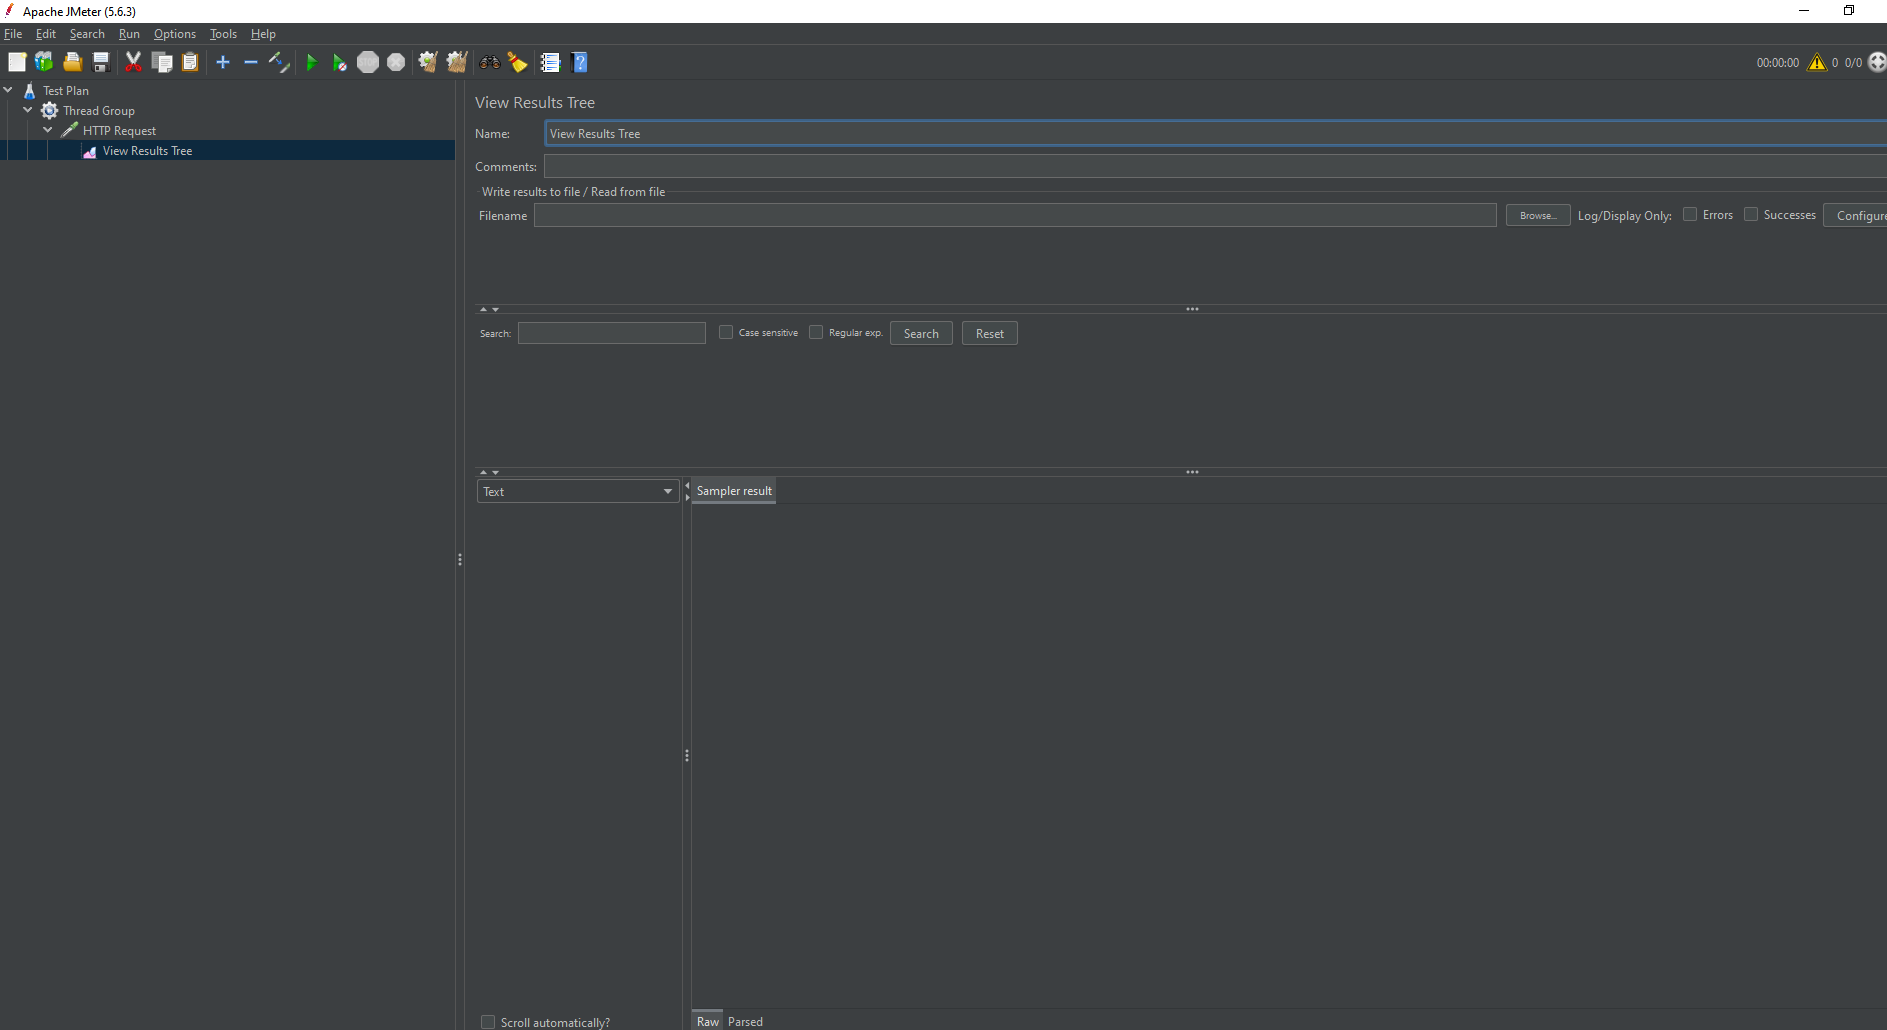
- Right-click on Thread Group.
- Add -> Listener -> View Results Tree or Graph Results.
Advanced Test Plan Configurations:
- Controllers: Logic controllers like If Controller, Loop Controller, and Transaction Controller to control the flow.
- Timers: Introducing delays between requests using Constant Timer, Gaussian Random Timer, etc.
- Config Elements: Configuring defaults like HTTP Request Defaults, CSV Data Set Config for parameterization.
- Pre/Post Processors: Using Bean ShellPreprocessor, JSR223 Preprocessor, Post Processors for custom scripting.
Scripting and Recording
Recording HTTP Requests Using JMeter’s Proxy:
#1. Set Up the Proxy:
- Open JMeter.
- Right-click on Workbench.
- Add -> Non-Test Elements -> HTTP(S) Test Script Recorder.
- Configure the proxy settings.
#2. Configure Browser to Use Proxy:
- Set your browser’s proxy to localhost with the port specified in JMeter.
#3. Record the Test:
- Start the proxy in JMeter.
- Perform actions in the browser to record the requests.
- Stop the proxy when done.
#4. Parameterization and Data-Driven Testing:
- Use CSV Data Set Config to read test data from CSV files.
- Parameterize requests by referencing CSV columns with ${column_name}.
Assertions and Validations
Adding Assertions to Verify Responses:
#1. Response Assertion:
- Right-click on the Sampler.
- Add -> Assertions -> Response Assertion.
- Configure expected response text or status codes.
#2. Duration Assertion:
- Ensure requests are completed within a specified time.
- Right-click on the Sampler.
- Add -> Assertions -> Duration Assertion.
Best Practices for Effective Validations:
- Use meaningful assertions to validate critical parts of responses.
- Avoid excessive assertions as they can impact performance.
Monitoring and Reporting
Configuring and Using JMeter Listeners for Monitoring:
- Add listeners like View Results Tree, Summary Report, Aggregate Report to monitor test results.
- Analyze response times, throughput, error rates, and more.
Generating and Interpreting Test Reports:
- Use Dashboard Report for comprehensive HTML reports.
- Configure report generation by adding the jmeter.save.saveservice.output_format=csv in the JMeter. Properties file.
Advanced Techniques
Distributed Testing with JMeter:
#1. Set Up Master and Slave Nodes:
- Configure JMeter on multiple machines.
- Set up JMeter. Propertiesinclude IPs of slave machines.
#2. Run Distributed Tests:
- Start JMeter server on each slave machine.
- Run the test from the master machine to distribute the load.
#3. Handling Dynamic Variables and Correlation:
- Use Regular Expression Extractor to capture dynamic values.
- Reference extracted variables in subsequent requests using ${variable_name}.
Performance Tuning
Identifying Performance Bottlenecks:
- Monitor CPU, memory, network utilization.
- Use JMeter's PerfMon plugin for system resource monitoring.
Strategies for Improving Test Performance:
- Optimize test scripts by reducing unnecessary requests.
- Increase heap size if encountering memory issues.
- Use distributed testing for higher loads.
Integration with CI/CD
Automating JMeter Tests in CI/CD Pipelines:
- Integrate JMeter with Jenkins or other CI tools using plugins.
- Schedule automated performance tests as part of the build pipeline.
Integrating JMeter with Tools like Jenkins:
#1. Install JMeter Plugin in Jenkins:
- Go to Manage Jenkins -> Manage Plugins -> Available -> Performance Plugin.
#2. Configure JMeter Job:
- Create a new Jenkins job.
- Add a build step to run JMeter tests using command line or JMeter plugins.
Tips and Best Practices
Common mistakes and How Avoid Them:
- Ensure correct test environment setup.
- Use realistic test data.
- Gradually increase load rather than sudden spikes.
Tips for Writing Efficient and Maintainable Test Scripts:
- Modularize test scripts using test fragments.
- Use meaningful names for samplers and variables.
- Document your test plans.
Conclusion
Offering a broad range of features and capabilities that make it useful for testing different applications and protocols, JMeter is a flexible and strong tool for load and performance testing. Performance bottlenecks can be found, and real-world scenarios can be properly simulated by taking an organized approach, which includes anything from setting up JMeter and making thorough test plans to more complex methods like distributed testing and interaction with CI/CD pipelines.
About Author
 As a Test Analyst at PixelQA a Software Testing Company, Renuka Thakor commenced her journey in the IT industry in 2021. Progressing from a manual tester, she refined her testing techniques and embraced tools for enhanced productivity.
Her commitment to staying abreast of the evolving testing landscape through continuous learning aligns with her future goal of transitioning into an automation testing position.